You can set custom colors and custom formats for custom members. This allows you to display colors based on your own logic, rather than the out of the box color indicators. This logic can be set in two ways: in the data source itself, or in the Formulas module. Continue reading to learn how to set custom colors and formats from the Formulas module, using the Save Format, Foreground Color, and Background Color functions in the Properties panel. To learn about using custom colors set in the data source, click here.
Formatting by cell allows users to color code data cells in the grid component to better separate values into tiers. Tiering of data visually helps users see outliers, trends, clusters and groupings of data within the result set of a given query. Formatting by cell also provides a mechanism to display certain values on the grid - like percentages or ranks.
Important: While custom formats are supported for cube and SQL data sources, custom colors are supported only for cube data sources.
Custom Colors
Note: This feature is only supported for cube data sources.
- Set the Foreground and Background colors in their respective panels
- Set custom colors using MDX
- Color settings can be written logically, to return different colors based on the value of the custom member
- Color settings are powerful, since they can use logic and values in a cube that extend well beyond what the user can see in result set itself. In turn, Pyramid will reflect these colors in the grid.
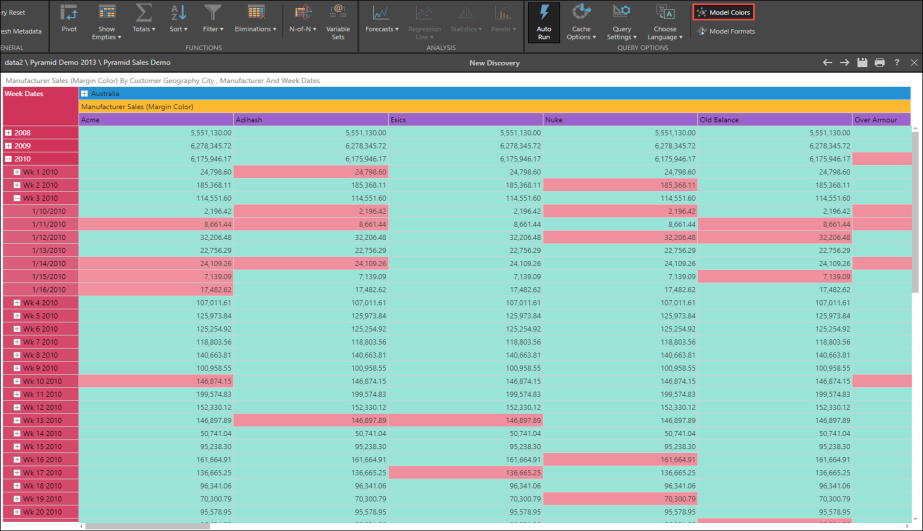
- To see the custom colors in the grid in Discover, you must enable Model Colors form the Query ribbon
RGB Format
The FORE_COLOR and BACK_COLOR cell properties store color information for the text and the background of a cell in red-green-blue (RGB) format.
The valid range for an ordinary RGB color is zero (0) to 16,777,215 (&H00FFFFFF). The high byte of a number in this range always equals 0; the lower 3 bytes, from least to most significant byte, determine the amount of red, green, and blue, respectively. The red, green, and blue use 8 bits each, and are represented by an integer between 0 and 255 (&HFF).
The PQL syntax for RGB is RGB(number,number,number). The PQL function returns the numeric calculation of 3 colors. For example, RGB(255, 0,0) = 255
Example
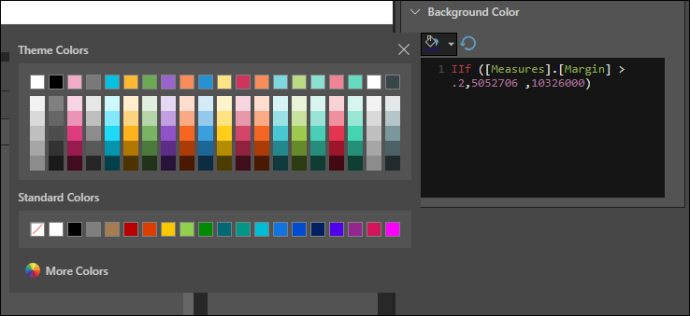
In this example, a custom member based on the data point, Manufacturers and Sales is created. In Background Color, an If statement is added:
IIf ([Measures].[Margin] > .2,14148762 ,10326000)
When the margin is greater than 20%, the cell will be displayed in blue. When it's below 20%, the cell will be displayed in red. To add a color condition to the statement, select the required color using the Color Picker menu (Paint Bucket). The color will be added to the MDX statement:
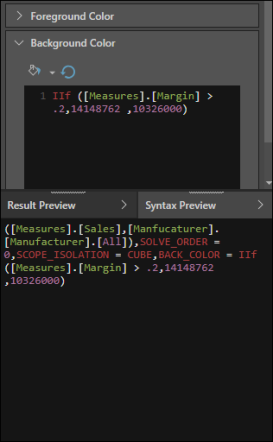
Click the Pyramid button to test the statement, and view the syntax:
When the custom member is added to the query in discover, you need to enable Model Colors from the Query ribbon (red highlight below). The grid will then be displayed with the background colors according to the margin in each cell: